When it comes to carbon footprints, location and lifestyle matter
A UC Berkeley analysis of the carbon footprints of households around the country shows that consumers need different strategies in different cities to reduce their greenhouse gas emissions. An online "carbon calculator" helps consumers decide how to change their lifestyles for the maximum reduction in their footprints.

April 13, 2011
Tips to reduce your carbon footprint frequently include buying compact florescent light bulbs, taking your own bag to the grocery store or buying local produce. But how much difference do these actions make?
A new study by researchers at the University of California, Berkeley, suggests that who you are and where you live make a big difference in which activities have the largest impact.
“Everyone has a unique carbon footprint,” says Christopher M. Jones, lead author of the study and a researcher in UC Berkeley’s Renewable and Appropriate Energy Laboratory (RAEL). “There is no one-size-fits-all set of actions that people should take.”
The study by Jones and RAEL director Daniel Kammen, a UC Berkeley professor of energy and resources who currently is on leave at the World Bank, appears in the current issue of the journal Environmental Science & Technology.
Carbon footprints are a measure of the greenhouse gases released during the production, use and disposal of products and services. The production phase includes all processes between the time raw materials are extracted from Earth until they reach consumers as finished products in stores. The study considers the carbon footprint of all household economic activity, including transportation, energy, food, goods, services, water and waste.
California vs. Missouri footprint
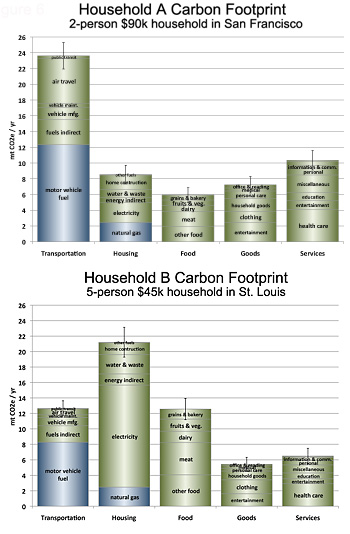
As an example, the report highlights the carbon footprints of two fictitious households: an upper-income couple living in San Francisco with no children, and a middle-income family with three children living in St. Louis, Mo. Each of these households contributes to the atmosphere about the same amount of greenhouse gases per year, but the sources of those emissions are very different, the study found.

A childless couple in San Francisco has a significantly different carbon footprint (top) than a three-child household in St. Louis. As a result, these households should use different strategies to reduce their carbon output.
Motor vehicles and air travel are the largest sources of emissions for the San Francisco couple, while electricity and food dominate emissions for the St. Louis family.
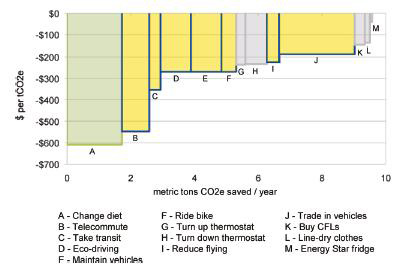
As a result, the opportunities to reduce emissions are vastly different. For the West Coast household, improving the fuel efficiency of their motor vehicles from 20 miles per gallon to just 25 miles per gallon would save the equivalent of completely eliminating electricity in their home. In environmentally conscious San Francisco, going further by driving gas-sipping hybrids may also enhance the couple’s social status.
The Midwest family, on the other hand, can save over $100 per month, or 5 percent of their monthly net income, by making healthier low-carbon food choices, such as reducing calories and buying chicken, fruits and vegetables instead of red meat, dairy and processed foods. Cutting electricity consumption by 20 percent would save them an additional $30 per month. Driving a slightly more efficient vehicle could save the household $50 per month and much more with ultra fuel-efficient vehicles, but this benefit must be balanced with safety concerns and convenience, given the demands of raising three children.
In all, the study analyzed typical household carbon footprints in all 50 U.S. states, 28 regions, six households sizes and 12 income brackets for a total of several thousand possible combinations of household types.
The results of this analysis have been summarized in an online “carbon calculator,” located at http://coolclimate.berkeley.edu, that can be used by any consumer to estimate his or her carbon footprint and identify the areas where lifestyle changes would create the largest reduction in greenhouse gas emissions.
“Our primary message is simple:If you are concerned about reducing your carbon footprint, or the carbon footprint of others through policy, it is important to focus on the actions that lead to the greatest reductions,” said Kammen. “Our online tool can help people do just that.”
Users can get a quick estimate of their carbon footprint profile by typing in their location, household size and income, then spend a few minutes answering basic questions about lifestyle for more personalized estimates. They can then compare their results to similar households and get a customized action plan.
“Comparative feedback is very important. People want to know how well they are doing compared to people like themselves,” Jones said.
Users also can create accounts and join groups of similar households to share their carbon footprint profiles and reduction strategies. An online competition allows cities, counties, community groups and businesses to compete against each other.

CoolCalifornia.org
With the help of Jones and Kammen, the California Air Resources Board (ARB) has launched a similar website, CoolCalifornia.org, designed to be a one-stop-shop to motivate and connect the millions of Californians who are taking action to minimize carbon footprints.
CoolCalifornia.org provides a wide range of tools and resources to help Californians make sustainable choices,” said Bart Croes director of research at ARB. “The carbon calculators under development by UC Berkeley are at the heart of CoolCalifornia.org, and are an important tool to help individuals, local governments, schools and community groups reduce their carbon footprints.”
For typical U.S. households, the newly published report claims about one-third of emissions are from transportation, a little more than 20 percent are from household energy, and about 15 percent are from food. All other emissions are from goods, services, housing construction, water and waste.
Jones noted that information alone is not enough. Program designers need to understand the motivations behind people’s actions and how to design programs to reduce barriers to adopting sustainable behavior and tap into social motivations that move individuals.
“If you want an effective program to reduce emissions, it is essential to recognize that individuals have different values, attitudes, beliefs, habits and abilities,” Jones said. The next stage for the CoolClimate Network (CCN), a RAEL project to analyze carbon footprints, is to recruit hundreds of households to systematically measure the effectiveness of various programs based on behavioral science.
These ideas will also be explored at the Behavior, Energy and Climate Change Conference, which is being coordinated in part by the UC Berkeley team and will be held in Washington, D.C., from Nov. 29 to Dec. 2.
“Most people are willing and many are actively seeking how to live more climate-friendly lifestyles. The question is whether we can do it fast enough to reduce some of the worst impacts of climate change. Figuring out what makes the greatest impact seems like a good first place to start,” Jones said.
For more information:
- Environmental Science & Technology paper
- Renewable and Appropriate Energy Laboratory (RAEL)
- At UC Berkeley, a tool that measures your carbon impact (July 19, 2011 Smarthplanet coverage)