Urban Displacement Project expands, updates its Northern California maps
Urban Displacement Project expands its research into housing pressures experienced throughout Bay Area and into the Valley
November 16, 2017

Expanded maps and information from the Urban Displacement Project at UC Berkeley illustrates the extent of affordable housing challenges throughout the Northern California “mega region.”
Expanded, refined and updated maps revealing the latest state of gentrification and displacement in communities stretching across Northern California are being released by the University of California, Berkeley’s Urban Displacement Project, in collaboration with the San Francisco Mayor’s Office of Housing and Community Development.
The maps reflect publicly available data rather than previously used proprietary information, making it easier to keep the mapping data up-to-date. They also feature four counties not previously part of the project’s database: Yolo, San Joaquin, Santa Cruz and Sacramento.
The latest additions bring the number of counties in the displacement mapping project to 13. Counties in the original database were San Francisco, San Mateo, Marin, Alameda, Santa Clara, Solano, Sonoma, Napa and Contra Costa.
“We are using regional, action-oriented data to address a regional problem,” said Miriam Zuk, director of the project, who works alongside UC Berkeley city and regional planning professor Karen Chapple.
Sacramento’s escalating displacement
“These maps confirm what many of us already know: Gentrification and displacement continue to be a crisis, and the crisis is touching the entire megaregion,” Zuk said. “As of 2015, 62 percent of low-income households across this 13-county region lived in neighborhoods at risk of displacement or already experiencing it. This is about 900,000 low-income households.”
“This is especially important right now as Sacramento, long seen as an affordable alternative to the Bay Area, is seeing escalating displacement and gentrification in neighborhoods like Oak Park and Midtown,” Zuk noted.
The latest mapping shows where communities are at risk of gentrification and displacement, where gentrification and displacement are taking place now, and which neighborhoods are in such advanced stages of gentrification that while considered low-income in 2000, today they are considered moderate- or high-income.
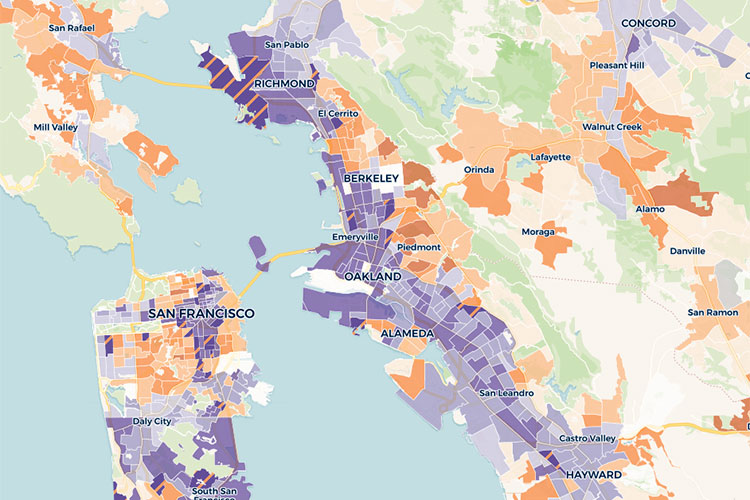
Explore an interactive table that shows the risks of gentrification and displacement in neighborhoods throughout the region. (Map courtesy of the Urban Displacement Project.)
Anti-displacement policies
The Urban Displacement Project also has mapped out the anti-displacement policies in place in the cities in the nine-county Bay Area.
Policy briefs on rent control, inclusionary zoning and condominium conversion regulations provide additional detail on how some of these policies work, and case studies illustrate how these policies and community organizing strategies can be combined to mitigate displacement.
For example, Chapple added, affordable housing developers have used the maps to guide decisions on subsidized housing sites and for evaluating the displacement potential of proposed projects in San Francisco’s Mission District.
“Policy design should be tailored to the conditions on the ground, and this means taking a community’s stage of gentrification and displacement into account. These maps allow advocates and decision-makers to assess a community’s current condition and formulate solutions based on that assessment,” Zuk said.
For instance, low-income communities at risk of gentrification and displacement may choose to focus on tenant protections and policies to preserve affordable housing stock, with their housing production emphasizing deed-restricted, low-income and inclusionary middle-income housing.
Moderate- and high-income communities with ongoing exclusion of low-income residents, on the other hand, may want to focus on preservation policies such as acquiring buildings and producing more market-rate and subsidized housing.
When comparing previous forecasts with new 2015 maps, the project researchers found that the rate of gentrification and displacement accelerated most quickly in Oakland neighborhoods, while exclusion advanced the fastest in San Francisco.
Advanced gentrification from the Mission to Diridon Station
Zuk noted the project’s striking findings for two well-known neighborhoods, the northeastern section of the Mission District in San Francisco, and the Diridon Station area in San Jose.
The Urban Displacement Project’s 2015 case study of the Mission found a significant decrease in the number of families and Latino residents in the historically majority family and Latino neighborhood. At the same time, Mission district rents for a two-bedroom apartment jumped from $3,800 in 2014 to $4,500 in 2016. Median household income in the northeastern section of the neighborhood was $109,141 in 2015, versus $81,294 in San Francisco overall, making it a significantly higher-income neighborhood within an already wealthy San Francisco.
Another dramatic example of gentrification can be found in San Jose’s Diridon Station neighborhood. A 2015 case study reported that the area was no stranger to displacement pressures, as a history of redevelopment in the 1980s that decreased affordable housing and increased market-rate housing.
But with upwards of $10 billion in rail investments and 240 acres available for development, the area is considered one of the Bay Area’s largest transportation and city-building opportunities, according to the non-profit San Francisco Bay Area Planning and Urban Research Association (SPUR). In addition, Google recently bought properties just south of the station with an eye toward building a transit-oriented village occupied by up to 20,000 employees.
Exclusion as a new mapping category
Meanwhile, the Urban Displacement Project also has added exclusion as a new mapping category, classifying moderate- and high-income neighborhoods according to their level of exclusion.
Zuk pointed to a recent project video, “Pushed Out: Displacement Today and Lasting Impacts,” which explains that exclusionary displacement occurs when rents are so expensive that low-income people are excluded from moving in.
Project maps show that the Bay Area’s moderate- and high-income neighborhoods lost 40 percent more low-income households than did low-income neighborhoods, suggesting that exclusion is more prevalent in the Bay Area than gentrification.
A ripple effect
Like higher-income communities, some communities typically seen as receiving those displaced from major cities — such as Pittsburg and Antioch — are undergoing their own displacement pressures in something of a ripple effect, as they generally lack tenant protections available elsewhere.
As a result, last year the number of people living unsheltered grew by 30 percent in far eastern Contra Costa, while the rest of the county saw declines. The increase in displacement pressure in places receiving new residents displaced from larger cities is fueling a new phenomenon, the super commuter, a subject of future exploration by the Urban Displacement Project along with research on race, displacement and fair housing in collaboration with the California Housing Partnership Corporation.
Berkeley News reported on the Urban Displacement Project when it launched in 2015.