From ‘corner stores’ to an online data marketplace
Berkeley's data analysts and administrators have long kept their own sets of data, which makes finding the information to answer institutional questions challenging even in best-case situatons. With direction from Berkeley's leaders, a campuswide data initiative takes a multi-pronged approach to address the problem.
October 11, 2010
When Chancellor Robert Birgeneau and his cabinet repeatedly couldn’t obtain reliable data to address questions on such topics as the campus’s budget, enrollment and financial aid, they realized they had an institutional-sized problem on their hands.

Shel Waggener, chief information officer and technology partner of the campus's Institutional Data Council (IS&T photo)
“Often when a question was asked, we had to double-check data and found that it was being reported differently in different places,” says Phyllis Hoffman, assistant chancellor and chief of staff to Executive Vice Chancellor and Provost George Breslauer. Those frustrating experiences in 2007 and 2008 were like “death by a thousand cuts.”
Like decision-makers in any large organization, Berkeley’s administration needs data about its key stakeholders and operational areas to keep the institution running smoothly. But at Berkeley, data analysts and administrators across the campus have long maintained caches of data relating to their own colleges, units or departments in the absence of any central system.
Currently, data relating to Berkeley’s applicants, students, faculty, staff, alumni and donor prospects is hosted and stored in more than 300 sites across the campus. “Data is the lifeblood of any campus — every department (and every application) needs robust data. Yet every time we build a new app and don’t use data from shared sources, we create yet another island of data, extending the ever-growing archipelago of campus data,” says Shelton Waggener, chief information officer and associate vice chancellor for information systems and technology.
“Each new island expands the challenge we face in answering even the most simple question because the data is scattered all over the campus,” continues Waggener. “We suffer from the dreaded ‘one-question-many-answers’ problem. Our goal should be to build bridges that safely connect all the data islands, as well as create a map and a shared location where we know the data will reside for everyone to use.”
Tired of navigating the campus’s maze of data collection, management and storage, Breslauer and former Vice Chancellor for Administration Nathan Brostrom decided to take action. They created the Institutional Data Management and Governance Initiative, which aims to make Berkeley’s data accessible, reliable, consistent and secure so that campus decision-makers can easily access up-to-date information to make informed choices.
To launch the initiative, Breslauer and Brostrom formed the IDMG Task Force and Advisory Group, which reviewed the campus’s data management and researched best practices at other universities.
As part of the assessment, the task force sponsored a 2008 survey in which a broad range of nearly 400 campus end-users — including members of the chancellor’s cabinet, deans, department chairs, research analysts and managers — registered their views about Berkeley’s data-management practices.
Survey respondents complained that departments on campus frequently maintain separate data systems, requiring significant staff time. Data is not updated reliably, resulting in short shelf-lives and conflicting “snapshots” of information. Respondents also noted that these departmental repositories are outdated and difficult to navigate, and the data may be hard to extract.

Erin Gore, AVC for budget and resource planning and co-chair of campus's Institutional Data Council
The task force developed a set of interdependent recommendations that offer a more cohesive way to manage the collection, analysis and presentation of campus data.
“Although we often treat data as if we each own a corner store with unique products, what we want to move toward more closely resembles an online supermarket where you are approved to use a range of products and the ingredients are certified,” says Katherine Mitchell, who works in the campus’s Center for Organizational and Workforce Effectiveness, and consults with Associate Vice Chancellor for Budget and Resource Planning Erin Gore on the initiative.
Gore and her technology partner Waggener are heading up the Institutional Data Council, a group of high-level campus leaders who advise them on priorities and directions that grew out of the task force’s recommendations.
When Gore arrived on campus in mid-2009, part of her charge was to implement the initiative’s recommendations. A critical near-term destination, says Gore, is the need for an enterprise-data warehouse, a single repository for key Berkeley information relating to such topics as admissions, alumni, course enrollment, financial aid, human resources and space on campus.
In addition to the creation of a central repository, there will need to be a cultural shift, says Mitchell, as campus members who work with data make the transition from keeping their own systems to contributing to a shared campuswide resource.
An inventory of successes
What are smart ways to collect and manage data? In the task force’s examination of campus best practices, it identified several successes at Berkeley.
As part of the IDMG initiative, a group of campus analysts examined roadblocks that made it difficult to answer the question: What impact does temporary academic support (lecturers and graduate-student instructors) have on the curriculum? The group found that in the existing decentralized data environment, analysts spent two-thirds of their time searching for or trying to access data to meet their needs.
Estimating course demand was particularly difficult, but recent upgrades to the Degree Audit Reporting System (DARS), which tracks information to simplify the complicated process of determining undergraduate students’ standing in satisfying graduation requirements, could help.
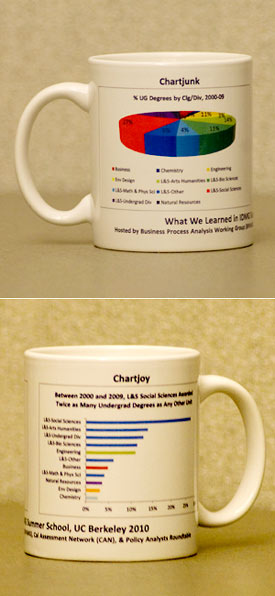
An IDMG mug displays, on two sides, dueling ways of displaying data graphically: "Chartjunk" (cluttered and unclear) vs. "Chartjoy" (clear and clean).
The Office of Planning and Analysis used DARS data to make the case for increasing temporary academic staff to help students fulfill the reading and comprehension requirement (which includes R&C courses like English 1A and 1B) by the end of the sophomore year. With DARS, analysts could access information on students satisfying the reading and comprehension requirement through Advanced Placement and community-college courses, thereby providing better estimates for R&C demand and current unmet need.
Informed by this analysis, Breslauer announced in March that the campus, using funds from 2009’s undergraduate fee increases and increased out-of-state enrollment, would allot $770,000 each year to increase the number of reading and comprehension courses it offers.
DARS is “an example of a central system that helps us access better data to support decision-making at the campuswide level,” says Pamela Brown, executive director in the Office of Planning and Analysis. Ensuring that the students could get the courses they need in a timely manner was “a sweet victory” and an example of what the IDMG initiative can help accomplish, says Brown.
Establishing definitions of campus terminology is another objective of Berkeley’s data initiative. Without common definitions, “you’re guaranteed to come up with different numbers” when researching questions, says Brown.
For example, staff, faculty, and student “employees” are now defined on the campus’s human resources website and counted twice annually in late April and October.
“Previously we didn’t have a common definition of an FTE [full-time equivalent],” says Mitchell. “That’s been a very challenging term to define.” Because of the efforts of Jeannine Raymond, assistant vice chancellor for human resources, and data analysts across the campus, “we now have agreement.”
Adds Brown: “The hope is that we can shift the debate from how you got the number to focus more on what the information is telling us.”
The joy of charts
In the campus’s 2008-09 institutional-data survey, department chairs indicated they felt underserved and in need of better data. Graduate Division Dean Andrew Szeri responded by developing the Graduate Program Reports.
Tailored for more than 100 departments, the 50-page reports are “comprehensive snapshots of statistics about everything from graduate-student finances to yield from offers of admission to academic progress and degree completion,” says Szeri, a member of the Institutional Data Council.
“Our challenge was to put the data together in a way that tells a story for program chairs,” says Szeri. “We built this comprehensive data set very systematically by determining what data is currently available, by anticipating the questions that people want to have answered, and by reaching out to department chairs and others to help shape the organization of the reports — all in the service of equipping faculty and staff with the information they need to engage in continuous improvement of our graduate programs and the graduate-student experience.”
Last December, the campus’s Center for Organizational and Workforce Effectiveness invited 30 Berkeley staff to a one-day seminar on presenting data and information with analytical-design guru Edward Tufte, an emeritus professor of political science, statistics and computer science at Yale University. Tufte advocates creating “visual information” and eliminating “chart junk” (such as a series of PowerPoint slides). He favors organizing data on a single sheet using charts, graphs, diagrams, maps, tables and text to create a highly memorable, readable message.
The attendees returned from the seminar and discussed how they could integrate Tufte’s approach to visually communicating information into their work at Berkeley.
To carry Tufte’s message to additional Berkeley staff, Gore and members of the Office of Planning and Analysis worked with campus-staff organizations to organize the IDMG Summer Series. Topics in the eight-session series ranged from how to make the most of data-presentation tools to tips from campus communication experts on framing a message. The series proved popular, attracting an average of 175 people for each session who took in the information in person or via online streaming video. More than 500 people have accessed the archived webcasts of the series.
“Thinking about ways to present information helps us translate our analysis for decision-makers,” says Brown, an organizer of the series. “Often we’ll look at a lot of data and will be tempted to illustrate to people all the work we’ve done to provide them with an answer, rather than showing them an easy-to-understand result.”
“What we want to present,” says Brown, “is the information that helps people make a decision.”
Gore is excited about the initiative’s progress to date. “As we move ahead, we need to think about data as a campus resource and wisely invest in systems that benefit more than one unit,” says Gore. “That’s what the IDMG initiative is all about and when it succeeds, we will all be better off.”