Teaching tools show climate change is just one aspect of a changing world
UC Berkeley scientists created a teaching framework for K-12 students to explain the complexities of Earth systems and climate change
November 16, 2020

Students Emily Tenaglia (left) and Giselle Ruiz (right) from Arizona using Understanding Global Change tools to model the many drivers and measurable effects of climate change in Alaska. (Photo courtesy of Clarissa Toupin)
Not every Arizona high schooler gets a chance to visit Alaska to study climate change.
In the summer of 2017, 23 lucky students flew with their teacher, Clarissa Toupin, to the city of Homer to test new teaching tools developed at the University of California, Berkeley, to help students understand the complex processes now altering our world and irreparably changing Earth’s climate. The students’ goal: to build and test a citizen science program to educate ecotourists about the impact global change will have on the state of Alaska.
The trip was a success for the students, the nonprofit Center for Alaskan Coastal Studies and the teaching units, which now, after four years of testing with thousands of students, are fully available to K-12 teachers and the public through the Understanding Global Change website.
“At the end of two weeks, the students were talking about these issues (of global change) with much more nuance and complexity than they were before,” Toupin said. “That is what we need in 21st century learners; that is what we need in problem solvers for the future.”
Appreciating the complexity — and reality — of global and climatic change is precisely the goal, said Jessica Bean, who developed the Understanding Global Change teaching modules with Charles Marshall, director of the UC Museum of Paleontology, and feedback from dozens of enthusiastic teachers like Toupin.

An infographic developed by the Understanding Global Change project to organize the complexity of global change processes and phenomena. The outer red circle represents all of the things that affect how the earth works (yellow circle) and creates measurable changes around the globe (blue circle).
“Understanding Global Change provides a framework and tools for thinking about all the parts of the world that we need to explain the complexity and feedbacks and interrelationships of how and why the world changes over time,” said Bean, who joined the incipient project in 2015 after obtaining her Ph.D. in earth and planetary sciences from UC Davis and accompanied Toupin to Alaska.
“We felt that in K-12 education and society, at large, there was a lack of understanding of how and why the climate and environment changes and the human role in those changes,” said Marshall, a UC Berkeley professor of integrative biology. “We felt, and still feel, that if there was broad appreciation of the nature of the connections between our actions and the way the climate, ecology and the environment all work, that it would lay the foundation for building a sustainable, a resilient future.”
Climate change may be the elephant in the room, and what draws in many teachers, he admitted, but climate change is only one aspect of the many ongoing changes worldwide.
“We realized that, even if there was not climate change, global change is still upon us with overpopulation, resource extraction and environmental change,” Marshall said.
An interactive, flexible framework
Funded primarily by a nearly $1 million grant from the Gordon and Betty Moore Foundation, Understanding Global Change is now part of science education curricula in schools in many states. It is integrated into the chemistry curriculum within the San Francisco Unified School District, is now being imbedded in Maryland science courses, including a yearlong class in biogeochemical systems, and is working its way into dozens of schools in Arizona, California and throughout the Western U.S.

An Earth scene on which a Gilroy High School student has placed icons, such as “Volcanoes” and “Rain & snow”, with comments and arrows explaining how they interact with Earth systems. (Image courtesy of Janet Lee)
The UGC has also partnered with a high school textbook company, National Geographic and the Climate Literacy and Energy Awareness Network (CLEAN), which is funded by the National Oceanic and Atmospheric Administration (NOAA), and the California Science Project. BioInteractive, a site for educators run by the Howard Hughes Medical Institute, worked with Bean to create the interactive online model that is a key way students explore and share their ideas about how Earth’s systems interact with the drivers of global change.
“This has been a really great framework,” said Janet Lee, a science teacher at Gilroy High School in her third year of using the resources to teach biology and physics. “At our school, we are trying to build on it, so that freshmen see these tools in biology, sophomores see it in chemistry, and they can start explaining more and more things about the biosphere, the atmosphere, the geosphere and the hydrosphere. Then, you have AP biology students analyzing the whole Earth system.”
For younger students, teachers can focus on a few ideas — represented as “icons” such as farming, renewable energy, photosynthesis, the water cycle or extreme weather — which can be used to construct conceptual models and focus discussions about how they influence or are affected by other parts of Earth’s systems. As students progress, they eventually learn to link more and more of the 70 concepts in the framework and place them within models showing how all are interconnected with Earth’s biology, geology, atmosphere and water sources.
“The project is designed to support learners of all ages to understand the earth, including humans and all living things, as a dynamic, interconnected system,” Bean said. “These systems thinking skills are necessary to find solutions to the societal and environmental problems we face today.”
When in-person classes were possible, Lee typically started out with paper models and cut-out icons, but UGC’s online interactive model helped her and her students transition easily to distance learning.
“It has been really useful in distance learning, because … a student can share a screen, and then they talk about moving icons, which way they affect each other,” she said. “It is a real cool tool, and it’s exciting to see it is all organized now (online).”
The UGC is also a great complement to two earlier online resources from UCMP: Understanding Evolution and Understanding Science. Lee uses all three in preparing her classes.
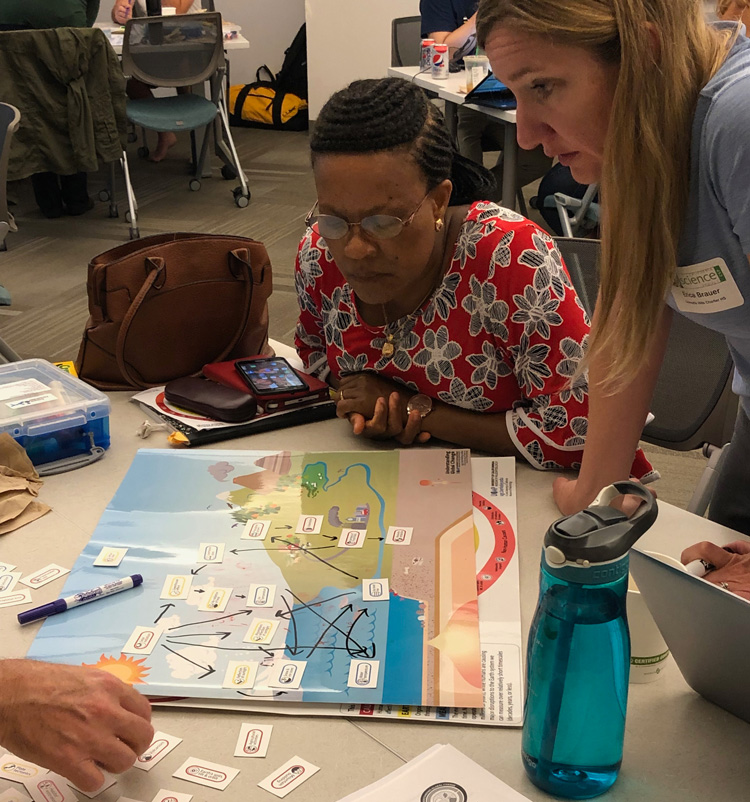
During a workshop, teachers learn how to place icons representing concepts such as photosynthesis or the water cycle on a colorful scene that illustrates Earth’s biosphere, atmosphere, geosphere and hydrosphere. (UC Berkeley photo by Jessica Bean)
Most K-12 science teachers who adapt the lesson plans are using them to teach earth sciences or biology, Bean said, but, as Toupin and Lee discovered, the concepts are broad enough to be integrated into any science curriculum. Toupin was one of the first to use the various units of UGC to teach a yearlong integrated science course covering physics, chemistry and biology during the years she taught at the Herberger Young Scholars Academy, a school for gifted students associated with Arizona State University in Phoenix.
The Understanding Global Change models were ideal for connecting many activities — whether building robots and electrical circuits or conducting physics and chemistry experiments — with global change. Other available curricula can be disconnected from students’ everyday lives.
“That is why I was so excited about the framework, because when you look at the model, there are so many opportunities (to connect activities with global change),” Toupin said. “There is an icon for technical innovation, so we had a mechanics unit where students built autonomous cars, they had solar panels, and they learned programming. But it was all connected to global change and innovation around solutions. Every single thing we did we could connect to global change. It was really awesome.”
The UGC lessons also help teachers and school district curriculum developers navigate the fraught politics of climate change without getting pushback from students or parents who dispute its reality.
“That is what is so wonderful about this model: You can talk about climate change without the political lens. It can be pretty difficult to do that,” Toupin said.
Next-gen science standards
One big draw of UGC is that it fills a need created by the 2013 Next Generation Science Standards (NGSS), which call for making science training more relevant to students’ experiences in the world and making class work more collaborative and interactive.

Clarissa Toupin working with two kids on the teaching framework Understanding Global Change. (Photo courtesy of Clarissa Toupin)
“The Next Generation Science Standards are very demanding,” Marshall said. “There has been a need to have something like this to help them meet the requirements of the standards.”
Chemistry, for example, is moving away from standard experiments, like mixing solutions and testing with litmus paper for acidity, to experiments and discussions more relevant to daily life. Linking acidity to the increasing acidity of the oceans from rising carbon dioxide levels in the atmosphere, and the impact of that on coral reefs, is one way of doing that.
“The San Francisco Unified School District is one great example of how these materials have been used to do what we call contextualized learning,” Bean said. “You aren’t just learning about acids and bases, but you are learning about ocean acidification. You are learning about how it affects ecosystems, you are connecting this to the biology and the atmospheric science of why ocean acidification is happening. It is about thinking broadly and making those systems connections within the curriculum.”
Five Bay Area teachers recently joined Bean as co-facilitators in a series of virtual workshops for the annual California Association of Science Educators Conference, where they enthusiastically shared how they integrated UGC into their science curricula. They were just a few of the many teachers across the country who have worked with and become captivated by the UGC project.
“Workshop participants are going back to their schools or districts and saying, ‘These are materials we want to use to teach science from an integrative, systems-thinking perspective,’” Bean said.
Understanding how Earth’s systems change over time, Bean and Marshall said, is key to understanding the scientific consensus that humans are accelerating climate change, setting the stage for increased fires, droughts, flooding, hurricanes, rising sea levels and more.
By the time students graduate, said Lee, a 2010 UC Berkeley graduate, “they see it (the connections), they remember it as educated voters and citizens and people who then make the decisions for the rest of the world.”

Bay Area educators posing with the Understanding Global Change model framework upon which the teaching tools are based. (Left to right) Vanessa Brunsing, Henriette Howett, Janet Lee (front), Elisa Prather (back), Sarah Machado, Jessica Bean and Devin Jackson. (UC Berkeley photo courtesy of Jessica Bean)
Toupin, who recently moved to Redmond, Washington, and is teaching at Willows Preparatory School, acknowledged that some of her students have initially been resistant to accepting the reality of climate change, but when taught from the perspective of ongoing global change, their resistance usually melted away.
“I only talk about climate change in terms of evidence and models,” she said, which are part of the UGC teaching aids. “I have activities where the students … dig into the NOAA database, and they get a bunch of data on ice extent, they graph it over time, they learn about trend lines, and then they make their own predictions. We look at dataset after dataset to build this bigger picture. And we understand what … it means to have a scientific consensus, and that there is no point to rejecting it.”