Tracking inequality in real time — a powerful new tool from Berkeley economists
The new data brings good news: For the U.S. working class, economic recovery from the pandemic has been remarkably strong
January 31, 2022
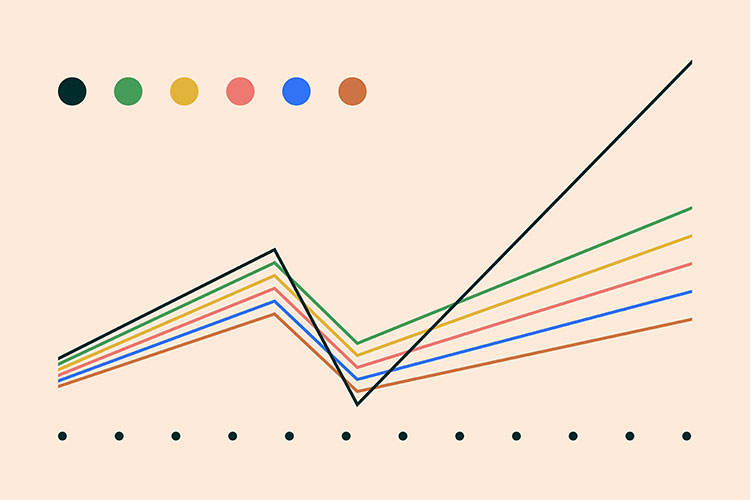
A powerful new web tool from a team of prominent Berkeley economists will allow users to track, almost in real time, how economic growth and policy affect the distribution of income and wealth in the United States. (UC Berkeley illustration by Neil Freese)
UC Berkeley economists have launched a powerful new web tool that allows users to track, almost in real time, how economic growth and public policy affect the distribution of income and wealth among classes in the United States.
The website, Realtime Inequality, is an extension of the pioneering work done by Berkeley economists Emmanuel Saez and Gabriel Zucman that explores how law and policy in the U.S. and worldwide result in profound inequality in the distribution of economic resources.

Gabriel Zucman (UC Berkeley photo)
But there’s positive news embedded in the new site: The recovery from the economic crisis caused by the COVID pandemic has been remarkably strong for the working class.
In 2021, U.S. national income per adult grew 7.6%. For the lowest half of American adults, whose income had stagnated for decades, income before taxes and government transfers rose an amazing 11.7%.

Emmanuel Saez (UC Berkeley photo by Cayce Clifford)
During the previous economic downturn — the great recession that started in December 2007 — it had taken 11 years and 10 months for the bottom 50% to recover its pre-crisis income level. This time it took only 20 months.
The picture is even rosier after considering government intervention in the economy. Thanks to federal COVID-relief programs — economic impact payments, unemployment insurance and an expanded child tax credit —

Thomas Blanchet (Photo by Olivia Ronsain)
disposable income for the lower half of American adults was 20.3% higher in 2021 than in 2019.
The federal government generates dense streams of economic data, but “a major gap in the economic statistics has been the lack of timely estimates of inequality,” Zucman said.
“While we know how the gross domestic product evolves quarterly,” he explained, “we do not know which groups of the population benefit from this growth and which benefit less from it, or potentially not at all. This gap severely limits the ability of governments and central banks to design effective policies, especially in crisis situations and in the aftermath of recessions.”
Zucman and Saez developed Realtime Inequality along with Thomas Blanchet, a UC Berkeley economist and postdoctoral researcher.
Their effort to fill the knowledge gap with data on inequality has produced a web tool that is incredibly powerful, and yet easy to use and easy to understand.
It shows different measures of income — pre-tax, post-tax, disposable and others — across different time frames extending back to 1976. It can assess the flow of economic benefits or losses for specific blocs of the population, from the bottom 50% of earners to the top 1% and even the top 0.01%.
In addition, it can assess both income inequality and wealth inequality.
Realtime Inequality is driven by data from the U.S. Department of Labor, the Bureau of Labor Statistics, the Bureau of Economic Analysis and other sources. Based on those data streams, the website offers a month-to-month picture of how income in the U.S. is distributed.
That depth and immediacy give it enormous potential value for policymakers, business leaders, researchers and journalists.
For example, Zucman said, the tool provides insight into the dynamic of inequality during the COVID pandemic, and how that was shaped by government policy.
Or it could be used after a recession, he explained, to estimate the extent to which income remains below its pre-recession trend for different income groups. Since the data include all taxes and government transfers, they allow assessment of whether policy enacted after a crisis effectively addresses income losses for the working class.
In a crisis, or in the aftermath of a recession, the tool could help policymakers “to target government support to those who most need it, and to better time fiscal and monetary policy,” Zucman said. Further, it could help governments “avoid situations where income support is withdrawn too quickly” from vulnerable households.
Realtime Inequality is the culmination of work begun almost a decade ago by Saez, Zucman and others to closely tie analysis of economic growth to the analysis of inequality. And it complements work they’ve done globally through the World Inequality Database, providing a more immediate comparison of dynamics for the U.S. working class and middle class compared to the superrich.