Seismic ‘CT scans’ reveal deep earth dynamics
A new look 100 miles beneath a massive tectonic plate as it dives under North America has helped clarify the subduction process that generates earthquakes, volcanoes and the rise of the Cascade Range in the Pacific Northwest.

September 22, 2016
A new look 100 miles beneath a massive tectonic plate as it dives under North America has helped clarify the subduction process that generates earthquakes, volcanoes and the rise of the Cascade Range in the Pacific Northwest.
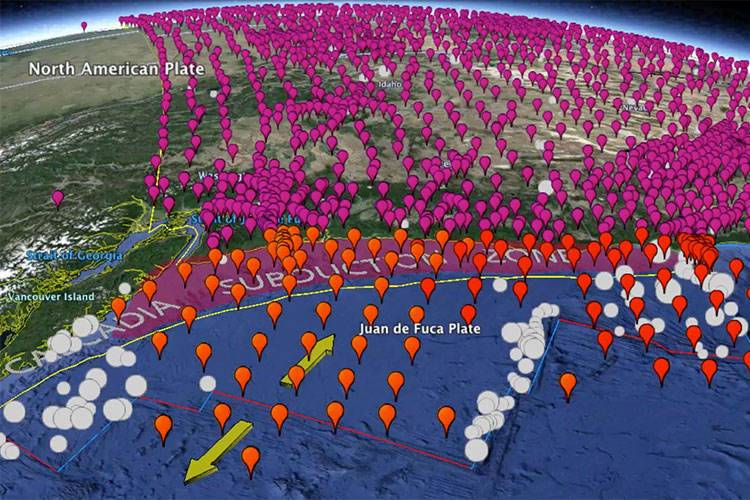
The largest array of seismometers ever deployed on the seafloor, coupled with hundreds of others operating in the continental U.S., has enabled UC Berkeley researchers to essentially create CT scans of the Juan de Fuca plate and part of the earth’s mantle directly below it.
The plate, about the size of the state of Michigan, is grinding under the continent along an 800-mile swath that runs from Northern California to Vancouver Island, known as the Cascadia subduction zone.
The 3-D imaging process, known as seismic tomography, has revealed with unprecedented clarity a huge, buoyant, sausage-shaped region of the upper mantle, or asthenosphere, pressing up on the oceanic plate.
The imaging casts new light on the competing hypotheses about the drivers of plate tectonics, a dynamic earth process that has been studied for more than 50 years but is still poorly understood.
Different evidence has led to three different plate movement scenarios: either the plates are pushed from mid-ocean ridges; or they are pulled from their subducting slabs; or their movement is driven by the drag of the viscous mantle material that lies directly below.
The new research suggests that the third scenario does not apply to the Cascadia subduction zone. Rather, it reveals that a distinct, thin — and difficult to observe — layer separates the plate from the mantle beneath, at least in the Cascadia subduction zone. The layer acts as a kind of berm that the plate rolls over before descending beneath the continent, says UC Berkeley seismologist Richard Allen, leader of the research and co-author of a paper appearing in the Sept. 23 edition of the journal Science.
“What we observe is an accumulation of low-viscosity material between the plate and the mantle. Its composition acts as a lubricant, and decouples the plate’s movement from the mantle below it,” explains Allen, who is director of the Berkeley Seismological Laboratory and professor and chair of Earth and Planetary Science at Berkeley. The plates may move independently of the mantle below, he adds.
The finding, he says, will help refine models of plate tectonic dynamics, aiding the long-range effort to understand the connection between tectonics and earthquakes.
“It is the motion of the plates that causes earthquakes,” Allen says. “Models like this help us understand that linkage so we can be better informed of the coastal hazards.
“First though, we need to learn if what we find here is typical of subduction zones across the planet, or if it is unique for some reason.”
Japan has recently deployed a massive seafloor seismic network to study subduction and earthquakes. Allen hopes to next apply the tomography strategy there. Alaska also beckons.
Lead author on the Science paper is William Hawley, a graduate student in Allen’s lab.
“Plate tectonics is the most fundamental concept explaining the formation of features we see on the earth’s surface,” Hawley says, “but despite the fact that the concept is simple, we still do not know exactly why or how it operates.
“If the asthenosphere acts as a lubricant for tectonic plate movement throughout the planet, it will really change our long-term models of the process” — dynamic changes that occur over a 100 million years.
“Modelers will have to take this lubricating layer into account because it changes the way the mantle and the plates talk to each other.”
Seismic tomography generates 3-D images of the earth’s interior by measuring how differences in shape, density, rock type and temperature affect the path, speed and amplitude of seismic waves traveling through the planet from an earthquake.
Much as in CT scans, computers process differences in energy measured at the receiving end to infer interior 3-D detail. CT scans use X-rays as the energy source, while seismic tomography measures energy from seismic waves.
A dense array of seismometers directly over the region of interest yields the best images and provides the highest resolution of the structures, which can then inform models of the process.
This study used the data from the largest scale ocean-floor deployment to complement the onshore data already available. Together, they generated the best images of the region to date.
The four-year seafloor research effort was made possible by the National Science Foundation’s ambitious $20 million Cascadia Initiative. The NSF aimed to spur greater understanding of plate structure, subduction processes, earthquakes and volcanism by deploying seismometers at 120 sites on the ocean floor, arrayed throughout the 95,000-square-mile Juan de Fuca plate.
Over the four years, the offshore and onshore seismometer array measured thousands of earthquakes throughout the planet, ranging from magnitudes of 5 to about 9 on the Richter scale. The study examined a subset of 321 quakes with magnitudes between about 6 and 7.5.
Grad students and faculty scientists participated in 24 research cruises to deploy the instruments and move them between two swaths of the Juan de Fuca plate. Several of the seismic tomography cruises invited undergraduate students on the two-week trips. On one Berkeley-led cruise aboard the R/V Thomas Thompson, the undergrads dubbed the trip the “Tom Cruise,” and sent daily video blogs. (https://www.youtube.com/
Richard Allen is director of the Berkeley Seismological Laboratory and professor and chair of Earth and Planetary Science at Berkeley.