New radio map of Jupiter reveals what’s beneath colorful clouds
View nearly 100 kilometers into the atmosphere shows immense plumes of ammonia
June 2, 2016
Astronomers using the upgraded Karl G. Jansky Very Large Array in New Mexico have produced the most detailed radio map yet of the atmosphere of Jupiter, revealing the massive movement of ammonia gas that underlies the colorful bands, spots and whirling clouds visible to the naked eye.
The UC Berkeley researchers measured radio emissions from Jupiter’s atmosphere in wavelength bands where clouds are transparent. The observers were able to see as deep as 100 kilometers (60 miles) below the cloud tops, a largely unexplored region where clouds form.
The planet’s thermal radio emissions are partially absorbed by ammonia gas. Based on the amount of absorption, the researchers could determine how much ammonia is present and at what depth.
By studying these regions of the planet’s atmosphere, astronomers hope to learn how global circulation and cloud formation are driven by Jupiter’s powerful internal heat source. These studies also will shed light on similar processes occuring on other giant planets in our solar system and on newly discovered giant exoplanets around distant stars.
“We in essence created a three-dimensional picture of ammonia gas in Jupiter’s atmosphere, which reveals upward and downward motions within the turbulent atmosphere,” said principal author Imke de Pater, a UC Berkeley professor of astronomy.
The map bears a striking resemblance to visible-light images taken by amateur astronomers and the Hubble Space Telescope, she said.

The VLA radio map (top) of the region around the Great Red Spot in Jupiter’s atmosphere shows complex upwellings and downwellings of ammonia gas that shape the colorful cloud layers seen in the approximately true-color Hubble Space Telescope map (bottom). Two radio wavelengths are shown in blue (2 cm) and gold (3 cm), probing depths of 30-90 kilometers below the clouds. Radio image by Michael H. Wong, Imke de Pater (UC Berkeley), Robert J. Sault (Univ. Melbourne). (Optical image by NASA, ESA, A.A. Simon (GSFC), M.H. Wong (UC Berkeley), and G.S. Orton (JPL-Caltech) )
The radio map shows ammonia-rich gases rising into and forming the upper cloud layers: an ammonium hydrosulfide cloud at a temperature near 200 Kelvin (minus 100 degrees Fahrenheit) and an ammonia-ice cloud in the approximately 160 Kelvin cold air (minus 170 degrees Fahrenheit). These clouds are easily seen from Earth by optical telescopes.
Conversely, the radio maps show ammonia-poor air sinking into the planet, similar to how dry air descends from above the cloud layers on Earth.
The map also shows that hotspots – so-called because they appear bright in radio and thermal infrared images – are ammonia-poor regions that encircle the planet like a belt just north of the equator. Between these hotspots are ammonia-rich upwellings that bring ammonia from deeper in the planet.
“With radio, we can peer through the clouds and see that those hotspots are interleaved with plumes of ammonia rising from deep in the planet, tracing the vertical undulations of an equatorial wave system,” said UC Berkeley research astronomer Michael Wong.
The final maps have the best spatial resolution ever achieved in a radio map: 1,300 kilometers.
“We now see high ammonia levels like those detected by Galileo from over 100 kilometers deep, where the pressure is about eight times Earth’s atmospheric pressure, all the way up to the cloud condensation levels,” de Pater said.
De Pater, Wong and their colleaugues will report their findings and highly detailed maps in the June 3 issue of the journal Science.
Prelude to Juno’s arrival
The observations are being reported just one month before the July 4 arrival at Jupiter of NASA’s Juno spacecraft, which plans, in part, to measure the amount of water in the deep atmosphere where the Very Large Array looked for ammonia.

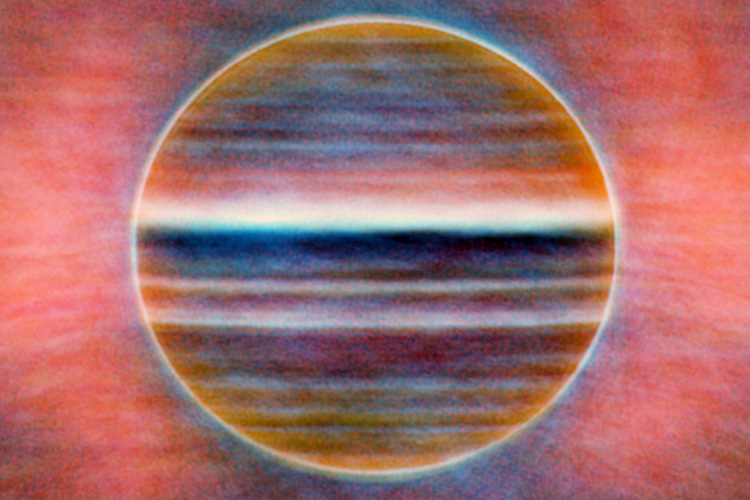
A radio image of Jupiter from the VLA at three wavelengths: 2 cm in blue, 3 cm in gold, and 6 cm in red. A uniform disk has been subtracted to better show the fine banded structure on the planet. The pink glow surrounding the planet is synchrotron radiation produced by spiraling electrons trapped in Jupiter’s magnetic field. Banded details on the planet’s disk probe depths of 30-90 km below the clouds. This image is averaged from 10 hours of VLA data, so the fine details seen in the other maps are smeared here by the planet’s rotation. Image by Imke de Pater, Michael H. Wong (UC Berkeley), Robert J. Sault (Univ. Melbourne).
“Maps like ours can help put their data into the bigger picture of what’s happening in Jupiter’s atmosphere,” de Pater said, noting that her team will observe Jupiter with the VLA at the same time as Juno’s microwave instruments are probing for water.
Key to the new observations was an upgrade to the VLA that improved sensitivity by a factor of 10, said Bryan Butler, a co-author and staff astronomer at the National Radio Astronomy Observatory in Socorro, New Mexico, which operates the VLA. “These Jupiter maps really show the power of the upgrades to the VLA.”
The team observed over the entire frequency range between 4 and 18 gigahertz (1.7 – 7 centimeter wavelength), which enabled them to carefully model the atmosphere, said David DeBoer, a research astronomer with UC Berkeley’s Radio Astronomy Laboratory.
“We now see fine structure in the 12 to 18 gigahertz band, much like we see in the visible, especially near the Great Red Spot, where we see a lot of little curly features,” Wong said. “Those trace really complex upwelling and downwelling motions there.”
The observations also resolve a puzzling discrepancy between the ammonia concentration detected by the Galileo probe when it plunged through the atmosphere in 1995 – 4.5 times the abundance observed in the sun – and VLA measurements from before 2004, which showed much less ammonia gas than measured by the probe.
“Jupiter’s rotation once every 10 hours usually blurs radio maps, because these maps take many hours to observe,” said co-author Robert Sault, of the University of Melbourne in Australia. “But we have developed a technique to prevent this and so avoid confusing together the upwelling and downwelling ammonia flows, which had led to the earlier underestimate.”
This research was supported by Planetary Astronomy and Outer Planets Research Program awards from the National Aeronautics and Space Administration. NRAO is a National Science Foundation facility operated under cooperative agreement by Associated Universities, Inc.
RELATED INFORMATION